TumorClassify
1. Project Introduction
A brain tumor classification model based on ResNet-50. The impact of various data enhancements such as geometric transformations, Mixup, and SamplePairing are explored. The accuracy and stability of brain tumor MRI image classification is of great significance to the healthcare system, but the traditional model has the defects such as difficult to handle complex features and unstable classification. In this project, we propose a new brain tumor classification model based on residual neural network, using three different data enhancement algorithms, namely, geometric transformation, mixup, and SamplePairing, to process a dataset containing four different types of brain tumor images, and then evaluating the classification effect of the model, and we found that the accuracy of the proposed model is improved and more robust than the traditional model, among which the best result is achieved by using geometric transformation for data enhancement. Among them, the best results are achieved by using geometric transformation for data enhancement.
2. Methods Introduction
2.1 Neural Network Model
In our study, we choose ResNet-50 in residual neural network model to classify brain tumor images. This neural network has the advantages of network generalization and arithmetic saving of the transfer learning method, and can avoid the gradient explosion and gradient disappearance caused by deepening the network. Brain tumor images usually have very complex features and information, and the learning ability of ResNet can increase with the network depth, which makes it more suitable for this kind of problem than other common neural network models.
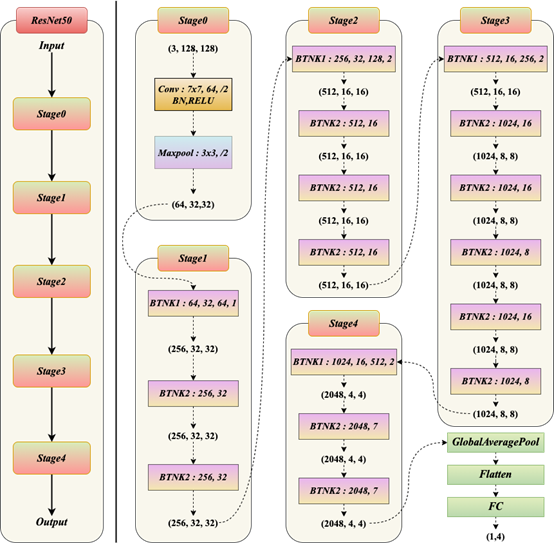
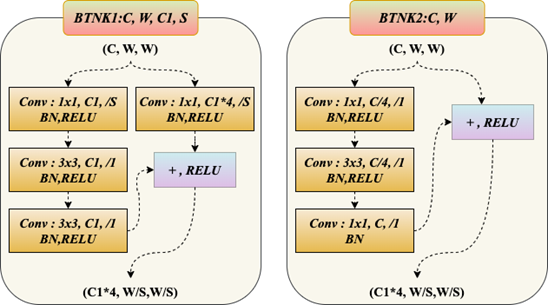
The ResNet-50 model used in our study is set up with four sets of blocks, 3, 4, 6, and 3 blocks each, with three convolutional layers inside each block. In addition the network has a convolutional layer at the very beginning, plus a sampling layer, as shown in Fig. 1, where the structure of BTNK1 and BTNK2 unfolding is shown in Fig. 2.
2.2 Data enhancement algorithms
2.2.1 Geometric transformation method
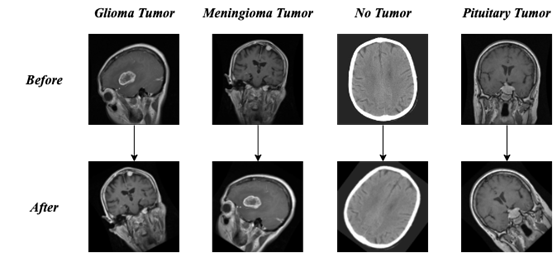
Geometric transformation is the geometric transformation of the image, including flip, rotate, scale and other types of operations, which can enrich the position and scale of the objects appearing in the image, so as to satisfy the translation invariance and scale invariance of the model. We use to rotate the image randomly between (-45,45) degrees and change the brightness of the image randomly to (0.8, 2.0) of the brightness of the original image, the specific transformation effect is shown in Fig 3.
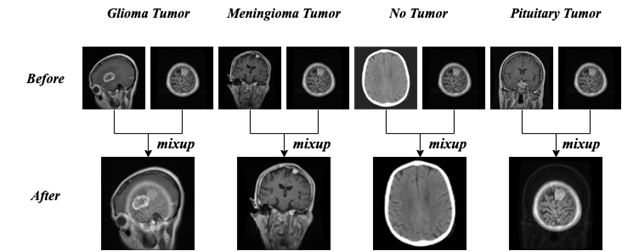
2.2.2 Mixup
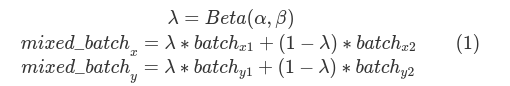
The second algorithm is Mixup, which is a data enhancement method based on the principle of neighborhood risk minimization, using linear interpolation to obtain new sample data. Assuming that it is a batch sample, which is the label corresponding to that batch sample; it is another batch sample, which is the label corresponding to that batch sample, and it is the mixing coefficients computed from the Beta distribution of the parameters α, β. The principle formula is shown in Equation 1 as follows.
In the mixup data enhancement process, we randomly select samples to operate with it, and the specific effect is shown in Fig 4.
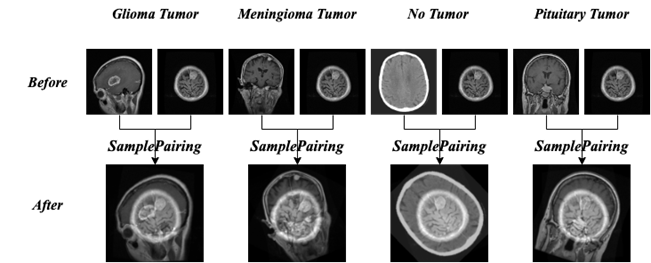
2.2.3 SamplePairing
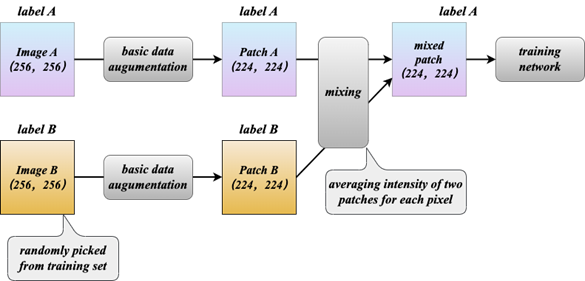
The third algorithm is SamplePairing, which is based on the principle that two images are randomly selected from the training set and processed by the basic data enhancement operation respectively, and then superimposed by the pixels in the form of taking the average value to synthesize a new sample, labeled as one of the original sample labels. These two images are not restricted to the same category, this method is more effective for medical image processing. The specific process is shown in Fig. 5 and the specific effect is shown in Fig. 6.
3. Results And Model Validation
3.1 Mixup
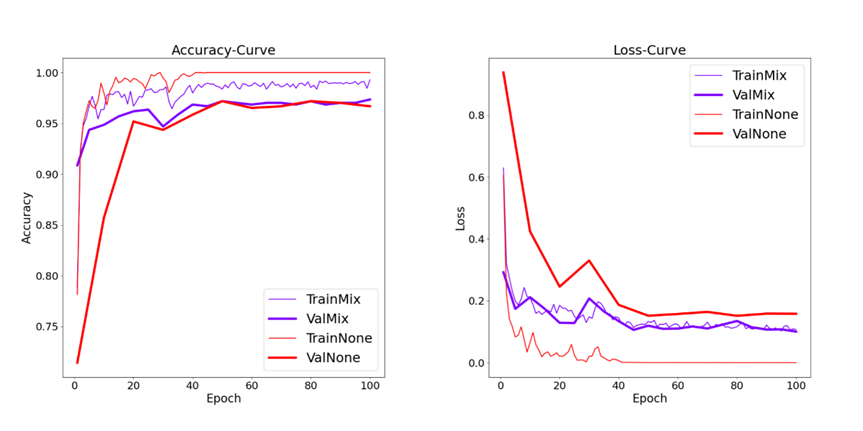
We first compared the model’s performance with no data enhancement and with Mixup. In the experiment, we use 50% images with Mixup and the parameter α was set to 0.2.
Loss and Accuracy curves in both training set and test set are shown in Fig 7. It can be seen from Fig 7 that the Mixup can make the model achieve faster convergence on the test set. In addition, after 100 epochs of training, Although the effect achieved by no enhancement in the training set is better than that achieved by the model with Mixup, the accuracy of the model with Mixup in the test set is higher. As can be seen from Table 1, the accuracy of the model with Mixup increases from 96.7% to 97.3%.
| Method | Accuracy | Loss | F1-Score |
|---|---|---|---|
| None | 96.7% | 0.16 | 0.965 |
| Mixup | 97.3% | 0.10 | 0.974 |
3.2 Random Rotation
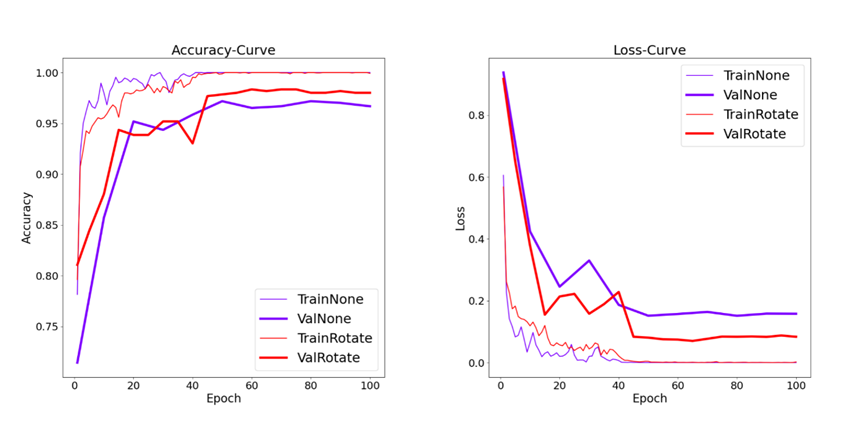
We then compare the performance of the model with no data enhancement and with random rotation. In the experiment, all the data in the training set were enhanced by random rotation, and the range of random rotation was (-45,45).
Loss and Accuracy curves in the training set and test set under the two conditions are shown in Fig 8. It can be seen from Fig 8 that there is little difference in convergence speed and performance of the models trained by the two methods on the training set. However, in the test set, the accuracy of the model trained by random rotation has been greatly improved compared with no data enhancement. As can be seen from Table 2, the accuracy of the model trained by random rotation has increased from 96.7% to 98.0%.
| Method | Accuracy | Loss | F1-Score |
|---|---|---|---|
| None | 96.7% | 0.16 | 0.965 |
| Rotate | 98.0% | 0.08 | 0.983 |
3.3 SamplePairing
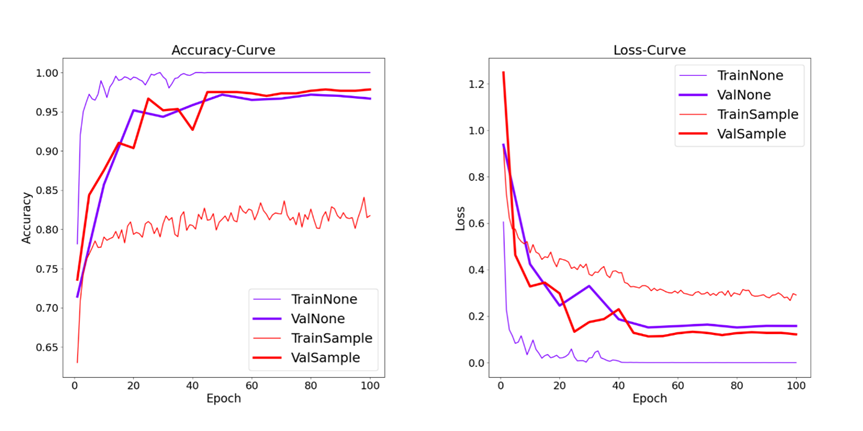
Finally, we compared the performance of the model with no data enhancement and with SamplePairing. In the experiment, we use 50% images with SamplePairing. The basic data enhancement in SamplePairing was also random rotation of (-45,45) degrees.
Loss and Accuracy curves of the training set and the test set in both cases are shown in Fig 9. It can be seen from Fig 9 that the convergence rates of the models trained by the two methods are not very different. However, the model trained by SamplePairing has poor performance on the training set and can only get about 80% accuracy after convergence. However, it performs well in the test set, and the final accuracy rate is higher than the case of no data enhancement. We can see from Table 3 that the final accuracy rate reaches 97.8%. By analyzing the processing process of SamplePairing, we hypothesized that the process only carries out the operation of adding and averaging pictures but does not integrate labels of pictures as Mixup, it may introduce training samples with different labels in the training process, resulting in poor performance of the model on the training set.
| Method | Accuracy | Loss | F1-Score |
|---|---|---|---|
| None | 96.7% | 0.16 | 0.965 |
| SamplePairing | 97.8% | 0.12 | 0.973 |
3.4 Comprehensive Comparison
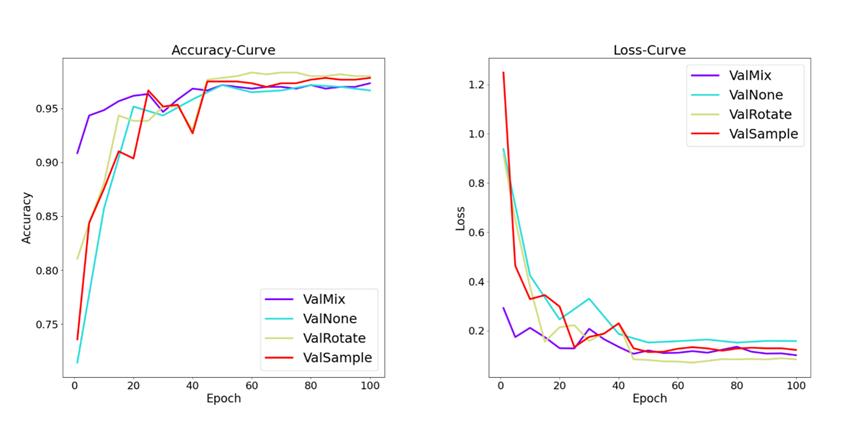
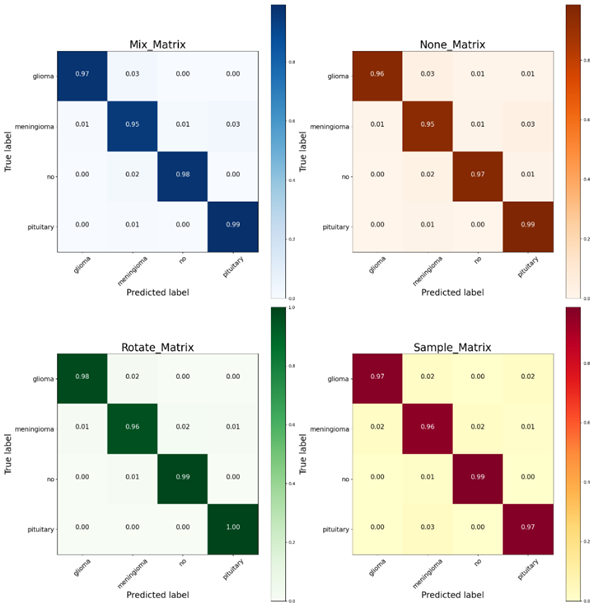
Accuracy and Loss of the model trained under the above four conditions on the test set were compared at the same time (Fig 10), and the analysis combined with the confusion matrix of each model (Fig 11) showed that in this classification task, Mixup, Random Rotation and SamplePairing can all enhance the performance of the model. The random rotation can improve the accuracy of the model the most, SamplePairing can also improve the performance of the model, while Mixup brings the least improvement.
4. Conclusion
In today’s world, brain tumors are one of the most common diseases, therefore, research has been carried out for brain tumor image classification. However, the existing classification models still have some problems and defects in practical use due to the complex features and uneven distribution of brain tumor datasets. This project focuses on the problem of brain tumor MRI image classification, aiming to classify four types of images, namely, Glioma tumor, Meningioma tumor, No tumor, and Pituitary tumor, and optimize the model to make it have better classification effect. Firstly, ResNet-50 is chosen as the basic classification network for training, and the experimental results show that the classification correctness rate reaches 96.7%, with an F1-Score of 0.965. Based on this, we used three data enhancement methods, namely Mixup, Random Rotation, and SamplePairing to train the dataset, and obtained the performance of the models trained in these three cases on the The performance of the model in the test set is 97.3%, 98.0% and 97.8% respectively, and the F1-Score values are 0.974, 0.983 and 0.973 respectively, which shows the performance improvement compared with the model without data enhancement, and on the whole, random rotation brings the biggest improvement effect. This indicates that the data enhancement algorithm can be used to optimize the ResNet-50 network.